Long term conditions

Lifestyle challenges are often a key risk factor for wider health conditions which lead to increased pressure on the system.

  • Prevalence of conditions such as Hypertension, Asthma, Coronary Heart Disease and Stroke in Staffordshire all remain higher than national.
  • Staffordshire's residents have a higher than average (22%) self reported Musculoskeletal condition. Staffordshire districts make up five of the six highest authorities.
  • GP registered Diabetes (Type 1 and 2) is higher than national and increasing faster than England. Recorded prevalence of diabetes is higher across all districts except Stafford. 

Self reported long term musculoskeletal problem (West Midlands districts and unitary authorities)


Horizontal bar chart showing the percentage of people reporting a long-term musculoskeletal (MSK) problem across local authority areas. Cannock Chase has the highest percentage at around 25%, followed closely by Newcastle-under-Lyme and Staffordshire Moorlands. Tamworth, South Staffordshire, Lichfield, Stafford, and East Staffordshire are also highlighted among the higher-ranking areas. England and the West Midlands region are marked in blue for comparison, with England showing a lower percentage than many Staffordshire districts. The chart uses yellow bars to highlight selected Staffordshire areas and grey bars for other authorities. The x-axis shows percentages from 0% to 30%.

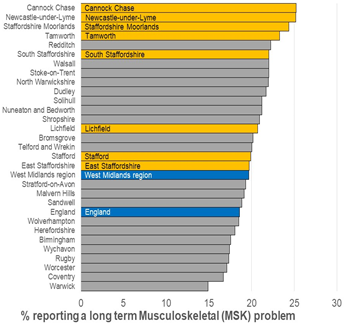
Source: GP Survey, 2020

Trends in GP registered diabetes prevalence (Type 1 and 2 – aged 17+) 


Line graph comparing the percentage of children in care in Staffordshire and England between 2006/07 and 2019/20. The blue line represents Staffordshire and the red line represents England. Both lines show a steady upward trend over time, but Staffordshire remains consistently above the England average throughout the period. Staffordshire rises from 4.7% in 2006/07 to 7.6% in 2019/20, while England increases more gradually from around 4.5% to just over 7%. The y-axis shows percentages from 0% to 9%, and the x-axis shows yearly periods from 2006/07 to 2019/20.


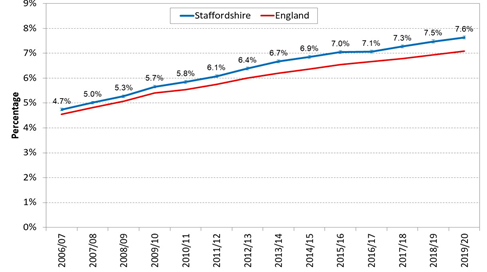
Source:  Quality and Outcome Framework, NHS Digital