Children's social care and SEND
Research shows that children and young people in receipt of social care are likely to experience poorer outcomes than others.
- Up until 2019 the rates of Children Subject to a Child Protection Plan (CPP were increasing, with a peak of 636. However, in 2020 we are seeing rates begin to fall.
- Rates for Children in Need have also fallen for two consecutive years in 2019 and 2020 (5,645), following a peak in 2018.
- Despite the recent fall in numbers, since 2016 rates of both Children in Need and Children in our Care levels have been consistently higher than similar authorities.
Increase in rates of LAC, CPP and CIN from 2017 to 2020
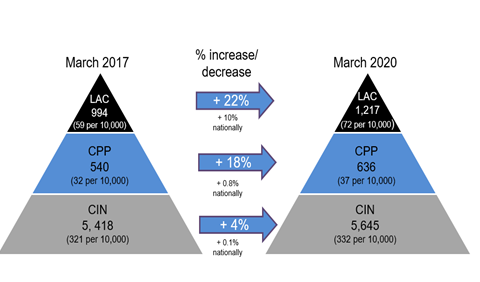
Source: Local Authority Interactive Tool, Department for Education
- In Staffordshire there are currently 1,217 children in our care - a figure that has been increasing and a rate (72 per 10,000) that is growing faster than national (67 per 10,000).
- Risk factors identified during children's social care assessments provide an insight into potential vulnerabilities. This helps us to target early intervention and prevention - in Staffordshire the top four factors relate to: mental health, domestic violence and substance misuse (drugs and alcohol).
Factors identified at child assessment 2020-21
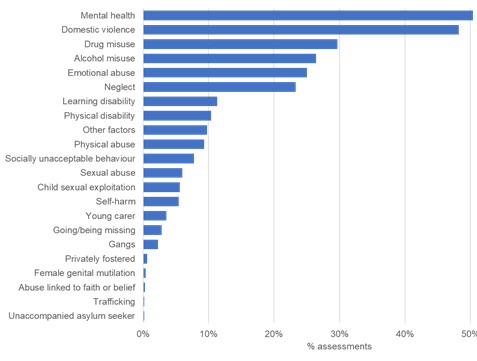
Source: Local Authority Interactive Tool, Department for Education
Special Educational Needs (SEND) support
- Staffordshire has a higher than average proportion of children & young people with EHCPs in its maintained schools (4.2% of all pupils) and has the highest rate among similar authorities.
- In the last five years EHCP numbers have also increased by two thirds - from 3,631 (2016) to 6,056 (2021) - a similar increase experienced nationally (68%).
- In contrast, SEN Support levels (10.3%) are among the lowest of similar authorities and below national.
- Evidence suggests children & young people with an EHCP are likely to experience poorer outcomes – just 6% of statemented/EHCP children achieve the expected standard in reading, writing and maths at KS2 (73% non-SEN) and 9% qualified to Level 3 by age 19 (62% non-SEN).
% of Pupils with Statement/EHCP and those at SEN Support, 2021
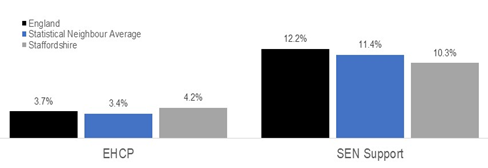
Source: Local Authority Interactive Tool, Department for Education
- In Staffordshire the majority (98.7%) with SEN Support attend a mainstream school. However, a higher proportion of EHCP children are educated in special schools (40%) and independent special schools (7%) – a higher proportion than national (31% and 5%) and the highest of similar LAs.
- This could partially be due to Staffordshire having a higher proportion of special school places. The picture is however changing with the proportion of EHCP children in mainstream education increasing since 2020 – 29.6% now attend a mainstream school compared to 27.3% last year.
- Autistic Spectrum Disorders (ASD) are the most common primary need for those with EHCPs, both in Staffordshire (26%) and nationally (31%).
Primary need (%), 2021
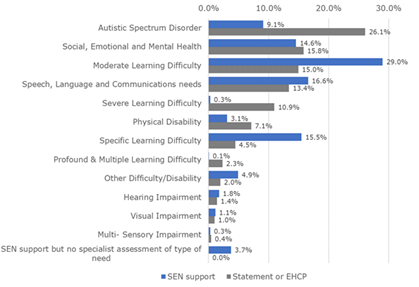
Source: Local Authority Interactive Tool, Department for Education