Excess weight in children
- 1 in 4 (25%) reception children are overweight or obese (excess weight) – worse than England and the second highest of similar authorities. However, by year 6 prevalence (34%) is lower than national.
- Activity levels remain a challenge with 1 in 3 children active for less than 30 minutes a day, higher than national (March 2020).
- East Staffordshire and Newcastle are key areas of focus with higher than average prevalence for both obesity and excess weight.
- Localities with the highest levels of excess weight for both reception children and year 6 include: Cannock East, Horninglow, Glascote, Holditch & Chesterton and Kidsgrove & Ravenscliffe.
Reception age obesity and excess weight (2017/18 - 2019/20)
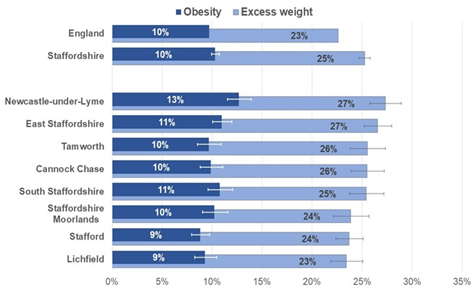
Source: National Child Measurement Programme, NHS Digital / Public Health England
Excess weight in reception (2017/2018 to 2019/20)
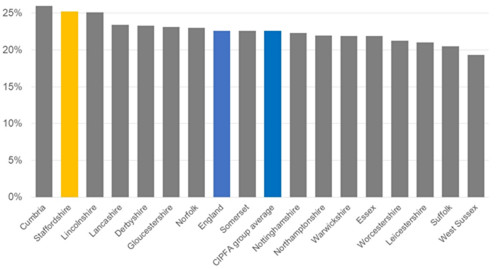
Source: National Child Measurement Programme, NHS Digital / Public Health England