Our use of cookies

We use strictly necessary cookies to make our site work. These cookies enable core functionality such as security, network management, and accessibility. The cookies collect information in a way that does not directly identify anyone. For more information on how these cookies work please see our privacy policy.

To agree to our use of analytical cookies, click the 'Accept cookies' button. No, give me more information.
Accept cookies Reject analytical cookies Manage cookies
 

School search key

All schools

GraphicMeaning
Ofsted

When a school is inspected by Ofsted, they give it a number which matches
an overall view of how the school is performing.

1 = Outstanding
2 = Good
3 = Requires Improvement
4 = Inadequate

Pupil Teacher Ratio

This is the number of pupils per teacher, on average, across the school

Over or under subscribed

Schools only have a set number of places that they can offer each year. If the school was oversubscribed last year, it means that either more people applied for a place than the number of places available OR the school filled all available places but made no refusals.

If a school was not oversubscribed, it means that, after all the places were given out, there were still places available at that school.

Pupils registered for free school meals This figure tells you the number of children at the school (as a percentage)
who are registered to claim free school meals.
Admissions criteria Admissions criteria are the rules used to allocate places at a school. They are different for each school.

Primary and middle schools

GraphicMeaning
% Pupils meeting the expected standard in reading, writing and maths

This tells you the percentage of children at the school who are meeting the expected standard in reading, writing and maths at age 11.

Pupils are meeting the expected standard if they achieve a scaled score of 100 or more on their Key Stage 2 test paper for maths and reading and they are assessed at 'working at the expected standard' by their teacher.

% Pupils achieving the higher standard in reading, writing and maths.

This tells you the percentage of children at the school who are achieving a higher standard in reading, writing and maths at age 11.

Pupils are achieving at the higher standard if they achieve a scaled score of 110 or more on their Key Stage 2 test paper for maths and reading and they are assessed as 'working at a greater depth within the expected standard' by their teacher. This standard is only achieved by the top 5% of pupils in England so a 0% score is not unusual.

AverageScaledScoreReading

This score is the average of all pupils taking the Key Stage 2 test in the school.

The expected standard is a score of 100 or more. The higher standard is 110 or more.

AverageScaledScore

This score is the average of all pupils taking the Key Stage 2 test in the school.

The expected standard is a score of 100 or more. The higher standard is 110 or more.

Reading-progress-score

This score shows how much progress children have made in reading between the end of Key Stage 1 (age 7) and Key Stage 2 (age 11) compared to other pupils across England who got similar results at age 7.

A score above zero and an upwards arrow means that pupils made more progress, on average, than similar pupils.

A negative score and a downwards arrow does not mean no progress, but less progress than similar pupils across England.

The Majority of schools have scores between -5 and +5.

Writing-progress-score

This score shows how much progress children have made in writing between the end of Key Stage 1 (age 7) and Key Stage 2 (age 11) compared to other pupils across England who got similar results at age 7.

A score above zero and an upwards arrow means that pupils made more progress, on average, than similar pupils.

A negative score and a downwards arrow does not mean no progress, but less progress than similar pupils across England.

The majority of schools have scores between -5 and +5

Maths progress score

This score shows how much progress children have made in maths between the end of Key Stage 1 (age 7) and Key Stage 2 (age 11) compared to other pupils across England who got similar results at age 7.

A score above zero and an upwards arrow means that pupils made more progress, on average, than similar pupils.

A negative score and a downwards arrow does not mean no progress, but less progress than similar pupils across England.

The majority of schools have scores between -5 and +5.

Seondary or high schools

GraphicMeaning
Progress 8 score SATS to GCSE

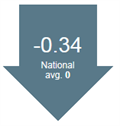
The score tells you how much progress pupils made between the end of Key Stage 4(GCSE) compared to other pupils across England who got Similar results when they were 11 years old. As 0 is the national average, a score above zero and an upwards arrow means pupils made more progress, on average than other similar pupils.

A negative score and a downwards arrow does not mean no progress, but less progress than similar pupils across England. The score is based on up to 8 approved qualifications. Most Schools in England score between -1 and +1. A score of +1 basicallymeans that on average, pupils achieve one grade more than pupils of a similar starting point. A score of -1 means they achieve one grade less.

Attainment 8 score Results in 8 core subjects 
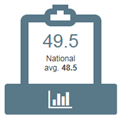
This score is based on how well pupils have performed in 8 key subjects (including English, maths, 3 qualifications including sciences, computer science, history,geography and languages and 3 additional approved qualifications.)Each GCSE is given a point score ranging from G = 1 to A* = 8 and attainment 8 is the average score per pupil.
5 A*-C GCSEs or 9-4 (or equivalent) inc. English and Maths This is the percentage of pupils at the school who achieved 5 GCSEs at grades A*-C or 9-4 including the core subjects, English and maths.
GCSE Grade C or better in English and Maths This is the percentage of pupils at the school who achieved Grace C or better in the core subjects, English and maths.
A Level progress score GCSE to A Level

This score shows how much progress pupils made between the end of Key Stage 4 (GCSE) and Key Stage 5 (A Level) compared to other pupils across England who got similar results at GCSE. As 0.0 is the national average, a score above zero and an updwards arrow means pupils made more progress on average than similar pupils.

A negative score and a downwards arrow does not mean no progress, but less progress than similar pupils across England.The majority of schools have progress scores between -2 and +2.

Pupils achieving AAB or higher at A Level inc.
two facilitating subjects.
This is the percentage of pupils achieveing three A Levels, graded at least AAB in ‘facilitating subjects’.Facilitating subjects are the ones commonly needed for entry to universities. These are: biology, chemistry, physics, maths, further maths, geography, history, English literature and classical or modern languages.
A Level Average Point Score This is the total point score achieved by students in all academic qualifications (including A Level, AS, International Baccalaureate and Pre-U) divided by those students’ total number of academic entries. An A* is worth 60 points, A = 50, B = 40, C = 30, D = 20 and E = 10.
Average A Level Result This is the average grade at A Level, converted from the average point score per academic entry.
Destination data work 
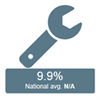
Gives you the number (as a percentage) of young people who went into either an apprenticeship or another form of structured work-based learning when they completed their school education. We show you the latest official validated data from the Department for Education (DfE). It is updated once a year.
Destination data education 
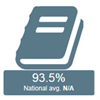
Gives you the number (as a percentage) of young people who went into further education when they completed their school education. We show you the latest official validated data from the Department for Education (DfE). It is updated once a year.

There are no results that match your search criteria