Public absence levels and exclusions
Other than illness, absence may be symptomatic of a range of issues related to school and/or home and can be an early indicator of issues.
- Positively, overall pupil absence (2018/19) remains below national, but is increasing – one to monitor as a key factor present in households requiring support from children’s social care.
- Pupil absence remains higher at secondary phase (5.4%) than primary (3.8%).
- Cannock Chase has higher than average absence levels for both primary and secondary phase and Tamworth and Newcastle is above national for just secondary phase.
Trend in Pupil Absence 2012-19
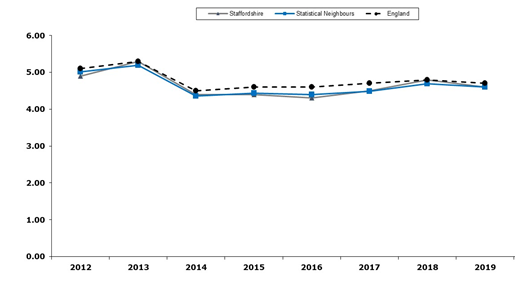
Source: Department for Education
- Overall absence levels were higher among FSM eligible pupils and children who had SEN support or an EHCP - a pattern seen nationally.
- Historically absence levels have always been higher for vulnerable groups, therefore COVID will not be the only factor to impact this.
Pupil absence, 2020-21
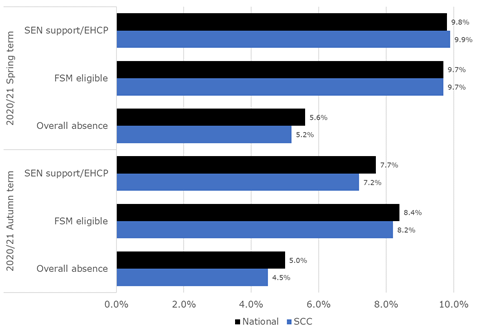
Source: Nexus
Pupil exclusions
- Permanent exclusions (2019/20) remains a key issue - higher than national for all schools and ranks poorly against similar authorities; 2nd worst for all schools.
- Addressing the root cause is key. Persistent disruptive behaviour being the most common reason for exclusion, and therefore likely to be symptomatic of underlying unmet needs.
- Note: Data for the 2019/20 academic year includes the start of the COVID-19 pandemic where comparisons to previous years should be treated with caution.
Percentage of permanent exclusions - all pupils
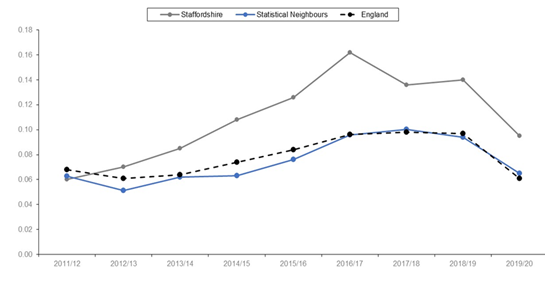
NB: Number of permanent exclusions expressed as a % of the whole school population, Department for Education
Source: Department for Education
- Staffordshire continues to record a higher than average proportion of permanent exclusions among vulnerable groups, such as pupils eligible for FSM and those with SEND.
- In 2019/20, 47 pupils were FSM eligible (0.31%), 35 pupils (0.29%) with SEN Support and 10 pupils with EHCPs (0.25%) were permanently excluded.
Percentage of permanent exclusions - SEND
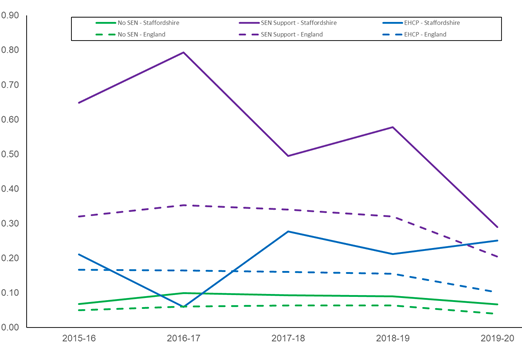
Source: Department for Education