Annual Report of the Director of Public Health 2021
Covid in Staffordshire: impact and opportunities
The Covid pandemic is the most serious crisis to befall our country since the second world war. It has now been almost two years since the first cases in England and during that time all of our lives have changed – for some people permanently. In Staffordshire we have had over a hundred thousand cases, thousands of hospitalisations and sadly over 2,000 deaths from Covid. Schools and businesses have been affected, with children’s education disrupted and many losing their livelihoods, and we have endured restrictions on our lives for prolonged periods. We continue to face uncertainty about what the future might hold.
But the pandemic story is also a story of hope. In the face of the crisis people pulled together like never before. Staffordshire’s response to Covid was a massive collective effort by the public sector, voluntary organisations, residents and businesses to minimise the spread of infection and protect those most at risk. Health and care services have kept going in the face of intense pressures, we have innovated to find new ways to keep the economy and society going, and people have stepped forward to support the most vulnerable. The vaccination programme has been a triumph of science, logistics and the will of the public to overcome the virus.
This report examines the Covid pandemic in Staffordshire from its inception until summer 2021 when restrictions were lifted. It does not unfortunately signal the end of the pandemic: at the time of publication Covid is unfortunately still with us and we are facing the threat of new variants of the virus. However the spirit that has seen us through the last 21 months as well as the learning from our response will serve us in good stead as we look to the future. I would like to thank every organisation and every individual who has contributed to the response and I hope you find the report of interest.
Dr Richard Harling
Director of Health and Care
Contents
1.1. Coronaviruses are a type of virus that cause illnesses ranging from the common cold to severe respiratory illness and death.
1.2. At the end of 2019 a new strain of Coronavirus emerged with the first cases identified in Wuhan, China. The virus was labelled SARS-CoV-2 and the disease Coronavirus Disease 2019 (Covid-19). The virus was previously unknown in humans. The exact origins remain unclear, but it is believed to have spread to humans via animals.
1.3. SARS-CoV-2 is transmitted through respiratory droplets (from breathing, coughing, sneezing or talking) and touching contaminated surfaces or people.
1.4. About one third of people infected are asymptomatic. For people who develop symptoms they are similar to influenza.
1.5. Around 40% of people those who develop symptoms have a mild illness; 40% have a moderate illness, which may include non-severe pneumonia; 15% have a serious illness, which may include severe pneumonia; and 5% have critical illness, which can lead to life threatening complications. People who have more serious illness may also be at higher risk of longer-term complications ,commonly known as “long-Covid”.
1.6. The risk of serious illness is higher in some groups:
- People who are older
- Males
- People from some non-white ethnic groups
- People with underlying health conditions, including obesity.
1.7. The emergence of SARS-CoV-2 has had a huge impact globally. Governments all over the world have imposed restrictions on people’s movements to control the spread of the virus and prevent health services from being overwhelmed.
1.8. This report considers how Staffordshire has been affected, our response and what we have learned that may help us in the future.
2019
DECEMBER
31st: China alerts WHO to several “pneumonia” cases, with unknown cause
2020
JANUARY
11th: China announces first SARS-CoV-2 death
29th: First 2 cases of SARS-CoV-2 recorded in UK
MARCH
14th: UK supermarkets release a joint letter asking people not to panic buy
23rd: The Prime Minister (PM) places UK in ‘lockdown’
APRIL
6th: The UK SARS-CoV-2 death toll reaches 5000; the total number of reported cases approaches 52,000
MAY
1st: UK government meets target of 100,000 Coronavirus tests per day
20th: The number of people in hospital with Covid drops below 10,000 for the first time since March
JUNE
1st: Primary schools re-open
15th: All non-essential retailers permitted to reopen
19th: The UK’s alert level is lowered from level 4 to level 3
29th: Stricter lockdown measures are introduced in Leicester following a surge in cases
SEPTEMBER
21st: The UK Coronavirus alert level is increased to level 4, because transmission rates are high and rising fast
24th: New regulations come into force, prohibiting entertainment and leisure establishments from opening between the hours of 22:00 and 05:00
OCTOBER
14th: A three tier system of restrictions is introduced. Liverpool is the only area to be placed in the very high category
15th: The UK reaches 1 million Covid cases
NOVEMBER
5th: England’s second national lockdown begins
DECEMBER
2nd: England’s new 4 tier system comes into force
8th: Margaret Keenan, 90, becomes the first person to receive the Pfizer Covid vaccine as rollout of vaccines begins
2021
JANUARY
4th: The first AstraZeneca vaccine is administered in the UK, as another full lockdown is announced
11th: 2.3 million people have received the vaccine
26th: The total number of UK deaths passes 100,000
30th: 8.9 million people have received their first Covid vaccine
FEBRUARY
24th: The number of people to have received their first dose of the vaccine reaches 18 million
MARCH
12th: ONS data for the week ending 6 March suggests Covid infections continue to fall in England and Wales
29th: The stay at home order for England comes to an end
APRIL
3rd: 31.4 million people have received a first COVID vaccine, with 5.2 million of those having also received a second
8th: A scientific study shows the number of Covid infections has fallen by two thirds since February and that the vaccination programme is breaking the link between Covid cases and deaths
MAY
23rd: 60 million vaccines administered. 22 million people have received the second dose
JUNE
1st: Zero Covid deaths recorded
5th: The number of people to receive their first vaccine in the UK passes 40 million; 27 million have received both vaccines
14th: Plans to lift Covid restrictions on 21 June are delayed until 19 July until every adult has been offered the vaccine
17th: The UK records 11,007 new Covid cases, the highest number since February 2021, and 19 deaths, the highest number for a month
JULY
19th: Covid restrictions removed
3.1. Cases
3.2. The number of new confirmed cases of Covid over the course of the pandemic is shown in Figure1, expressed as the number of confirmed cases in the previous seven days per 100,000 population (the seven-day case rate).
Figure 1: Seven-day case rate
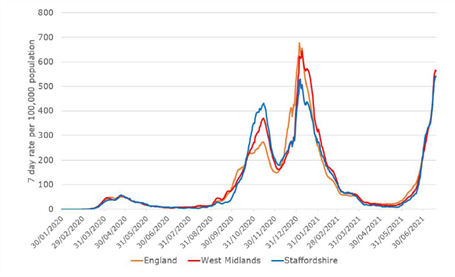
3.3. The cumulative number of confirmed cases in Staffordshire since the start of the pandemic reached just under 75,000 by 19 July 2021. The cumulative number of cases and cumulative confirmed case rate per 100,000 population for the county and each district and borough are shown in Table1, with East Staffordshire and Tamworth showing the highest number of cases relative to their populations.
3.4. Staffordshire had fewer confirmed cases relative to the population than the West Midlands or England averages, and this was despite higher testing rates for most of the pandemic period.
Table 1: cumulative confirmed cases and deaths from Covid
| District / Borough | Population (mid-2020 population estimates) | Covid cases | Covid cases per 100,000 population | Deaths within 28 days of a positive Covid test | Total |
|---|
| Cannock Chase |
101,500 |
8,317 |
8195.4 |
263 |
259.2 |
| East Staffordshire |
120,900 |
11,362 |
9396.1 |
414 |
342.4 |
| Lichfield |
105,600 |
8,256 |
7815.4 |
288 |
272.6 |
| Newcastle-under-Lyme |
129,600 |
10,723 |
8273.3 |
340 |
262.3 |
| South Staffordshire |
112,400 |
10,024 |
8920.6 |
254 |
226.0 |
| Stafford |
137,900 |
10,396 |
7541.1 |
324 |
235.0 |
| Staffordshire Moorlands |
98,400 |
7,116 |
7229.7 |
268 |
272.3 |
| Tamworth |
76,900 |
7,583 |
9865.5 |
205 |
266.7 |
| Staffordshire |
883,200 |
73,777 |
8353.6 |
2,356 |
266.8 |
| West Midlands |
5,961,900 |
529,974 |
8889.3 |
13,653 |
229.0 |
| England |
56,550,100 |
4,855,245 |
8585.7 |
113,632 |
200.9 |
Note: Cases from start of pandemic to 19th July 2021 / deaths from start of pandemic to 23rd July 2021
3.5. At the start of the pandemic there was very limited testing capacity, so it was possible to confirm only a small proportion of cases. Data about the initial wave of infections in spring 2020 therefore vastly under-represents the actual number of cases. Testing capacity in the UK increased substantially during 2020 and data about the second and third waves of infection in winter 2020/21 and spring 2021 better reflects the true number of cases. Even so, there are many cases that were not confirmed and therefore not enumerated.
3.6 Hospitalisations
3.7 The first and second waves of infection produced a huge pressure on health services, with around 8% of confirmed cases in the second wave being hospitalised across England. The success of the vaccination programme has meant that in the third wave of infections a much lower proportion, around 2% of confirmed cases, have been hospitalised.
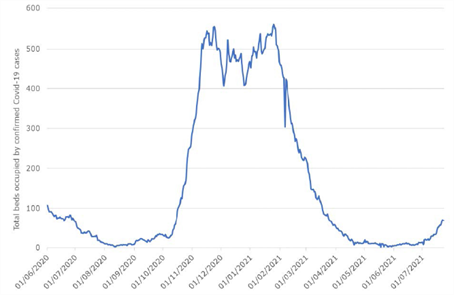
3.8 We only have data on beds occupied by Covid patients within Staffordshire and Stoke on Trent hospitals, which significantly under-represents the true number. This indicates around 550 hospital beds occupied by confirmed cases at the peak of the second wave of infection, as shown in Figure 2, with likely an additional 85% on top of this figure occupying hospital beds outside the county (estimate based on hospital admissions data).
Figure 2: Staffordshire beds occupied by Covid patients
3.9 Deaths
3.10 The first and second waves of infection also produced a significant excess of deaths. Covid related deaths are counted in two ways: at 23 July 2021 there had been a total of 2,356 deaths within28-days of a diagnosis of Covid in Staffordshire and 2,723 deaths where Covid had been recorded on the death certificate. The cumulative number of deaths within 28-days of a diagnosis of Covid and cumulative death rate per 100,000 population for the county and each district and borough are shown in Table 1, with East Staffordshire showing the highest number of deaths relative to its population.
3.11 Both of these measures are potentially flawed: they may under-represent the number of deaths if Covid is not diagnosed or recorded on the death certificate; conversely they may overrepresent the number of deaths if people die from other causes within 28 days of being confirmed as a case.
3.12 A better measure therefore is to look at the excess deaths from all causes during the pandemic period compared to previous years. At 23 July 2021 there had been a total of 13,758 deaths during the pandemic period, an excess of 1,911 compared to the average for 2015-19. The majority of excess deaths occurred during the first and second waves of infection as shown in Figure 3.
3.13 Of the total deaths 2,723 (20%) had Covid recorded on the death certificate and 11,035 (80%)were recorded as due to other causes; 6,436 (47%) occurred in hospital and 53% in the community with a higher proportion of deaths with Covid recorded on the death certificate occurring in hospital, as shown in Table 2.
Figure 3: excess deaths from all causes during the pandemic period
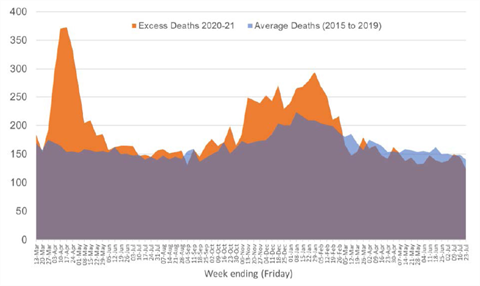
Table 2: location of deaths during the pandemic period
| Location of deaths | Deaths with Covid recorded on the death certificate | Deaths recorded as due to other causes | Total |
|---|
| Hospital |
1,998 (73%) |
4,438 (40%) |
6,436 (47%) |
| Community |
725 (27%) |
6,597 (60%) |
7,322 (53%) |
| Total |
2,723 (100%) |
11,035 (100%) |
13,758 (100%) |
Source: Office for National Statistics - Death registrations and occurrences by local authority and health board (Weekly extract)
3.14 The direct age standardised mortality rate (which takes account of differing ages of different populations) for deaths with Covid recorded on the death certificate was 274 in Staffordshire, significantly higher than the national average (Figure 4). The age standardised mortality rates in East Staffordshire and Tamworth were particularly high.
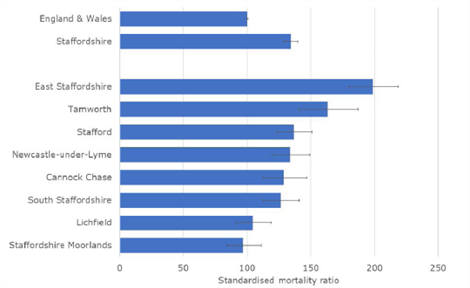
3.15 The indirect age standardised mortality ratio for excess deaths from all causes was 134 in Staffordshire, also significantly higher than the national average (Figure 5), and suggesting around 34% more deaths from all causes in Staffordshire than in England as a whole. Again the indirect age standardised mortality ratios in East Staffordshire and Tamworth were particularly high.
3.16 The explanation for relatively higher numbers of deaths in Staffordshire despite relatively fewer cases than the England average is not clear. It is possible that this may reflect a higher prevalence of risk factors for complications, such as excess weight and obesity, or diabetes. Two thirds of Staffordshire adults have excess weight - higher than the England average; and 7.6% are recorded as diabetic on general practice registers, again higher than the England average (7.1%).
Figure 4: direct age standardised mortality rate for deaths with Covid recorded on the death certificate (March 2020 to June 2021)
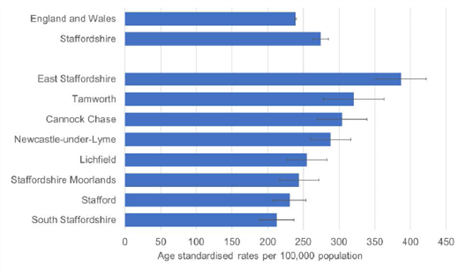
Figure 5: indirect age standardised mortality ratio for excess deaths from all causes (March 2020to June 2021)
3.17 Geographical variation
3.18 Throughout the pandemic we have conducted detailed surveillance and analysis of confirmed cases at ward level to support the targeting of the response, including communication campaigns.
3.19 Covid case rates have varied across Staffordshire with different wards experiencing higher case rates at various times. Taken across the course of the pandemic there are several wards where the cumulative confirmed case rate per 100,000 population has been higher, as shown in Figure 6. This has informed identification of ‘local areas of enduring transmission’ which will focus on going efforts with testing and vaccination.
3.20 High-risk groups
3.21 The pandemic has highlighted pre-existing health inequalities and, in some cases, increased them. Public Health England (PHE) published a report ‘Disparities in the risk and outcomes of SARS-CoV-2’ that highlights inequalities in the risk of complications and deaths from Covid as shown in Figure 7.
3.22 Age and gender
3.23 In Staffordshire the average age of all confirmed cases over the course of the pandemic was 41 years by 19 July 2021. The cumulative confirmed case rate was highest in young adults (aged 20-39 years) and in older people (aged 80 and above) as shown in Figure 8. Younger people are more likely to be asymptomatic and less likely to be tested and therefore the cumulative actual case rate among younger people is likely much higher. The high cumulative confirmed case rate in older people reflects more serious disease as well as high rates of asymptomatic testing, for example for care home residents. 48% of confirmed cases were in males and 52% in females.
3.24 Most Covid related deaths have been in older people - more so than deaths from all causes. 62% of deaths with Covid recorded on the death certificate have been in people aged 80 and above. 22% of deaths in people aged 80 and over had Covid recorded on the death certificate compared to only 13% of deaths in people aged 0-59, as shown in Table 3.
Figure 6: groups with higher rates of diagnosis and worse outcomes
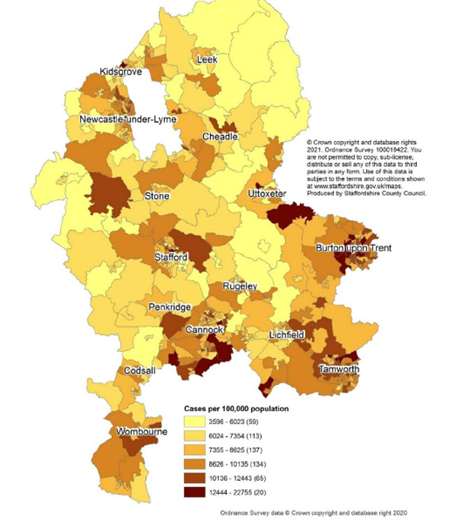
Figure 7: cumulative confirmed case rates to 19 July 2021 by age group
Age: The case fatality rate increases sharply with advancing age. People aged 80 or older diagnosed with Covid were seventy times more likely to die than those under 40.
Care home residents: Residents of care homes have a very high case fatality rate due to advanced age and multiple co-morbidities.
Gender: Working age males diagnosed with Covid were twice as likely to die as females.
Comorbidities: People with underlying health conditions including diabetes, high blood pressure, chronic kidney disease, chronic lung disease, and dementia and diagnosed with Covid were more likely to die than people without other illnesses.
Obesity: People who were obese and diagnosed with Covid were more likely to die than people with a healthy weight.
Deprivation: People living in the most deprived areas of England diagnosed with Covid were more than twice as likely to die as those living in the least deprived areas, for both males and females. This may be related to a higher rate of co-morbidities.
Ethnicity: People from Black, Asian and Minority Ethnic groups diagnosed with Covid were more likely to die than people from White Ethnic groups. This may be also related to a higher rate of co-morbidities as well as to higher rates of deprivation.
Occupation: People in some jobs including security guards, taxi drivers and chauffeurs, bus and coach drivers, chefs, sales and retail assistants, lower skilled workers in construction and processing plants, and social care have a higher risk of dying from Covid than the general population. This may be because they have a higher risk of infection and/or a higher case fatality rate if they are infected.
Figure 8: cumulative confirmed case rates to 19 July 2021 by age group
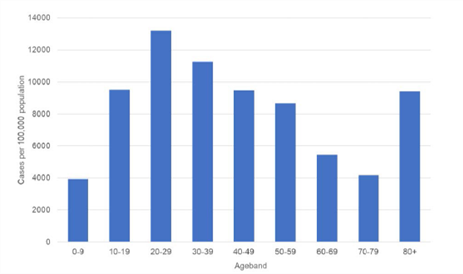
Table 3: age of all deaths during the pandemic period
| Age group | Population | Deaths with Covid recorded on the death certificate | Deaths recorded as due to other causes | Total Deaths | Relative risk of deaths for age group compared to whole population |
|---|
| 0-59 years |
633,044 |
152 (6%) |
1,005 (9%) |
1,157 (8%) |
0.08 |
| 60-69 years |
105,278 |
245 (9%) |
1,224 (11%) |
1,469 (11%) |
0.75 |
| 70-79 years |
91,368 |
638 (23%) |
2,718 (25%) |
3,356 (24%) |
2.26 |
| >80 years |
49,870 |
1,680 (62%) |
6,037 (55%) |
7,717 (56%) |
10.91 |
| Total |
879,560 |
2,715
(100%) |
11,010
(100%) |
13,704
(100%) |
1.00 |
Source: Office for National Statistics – Monthly mortality data – March 2020 to July 2021
Note: Percentages may not balance due to rounding
3.25 Case fatality
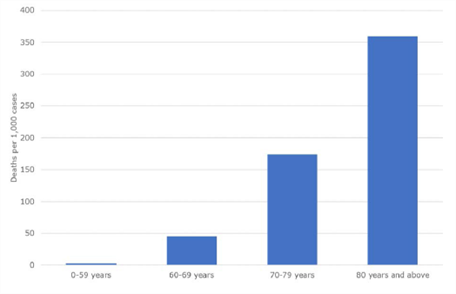
3.26 The case fatality rate is the number of deaths with Covid recorded on the death certificate, divided by the number of confirmed cases. The case fatality rate increases sharply with advancing age, as shown in Figure 9. Younger people are more likely to be asymptomatic and less likely to be tested. This means that the apparent case fatality rate will be lower in younger than older people, which means that the gradient of increasing case fatality rate with advancing age is likely even more pronounced.
Figure 9: deaths with Covid recorded on the death certificate per confirmed 1,000 cases (March2020 to June 2021)
3.27 Deprivation
3.28 In Staffordshire there has been a higher number of confirmed cases of Covid in more deprived areas, with the cumulative confirmed case rate highest in the 10% of most deprived wards ranked nationally and the lowest in the 10% of the least deprived wards, as shown in Figure 10. Testing rates have typically been lower in more deprived areas, as shown by the snapshot in Figure 11, and therefore it is likely that the gradient of higher actual cumulative case rates in more deprived areas is even more pronounced.
3.29 There is no clear relationship between mortality and deprivation, either as measured by deaths with Covid recorded on the death certificate or excess deaths from all causes, as shown in Figures 12 and 13. This may indicate that whilst people in deprived areas are more likely to be infected they are no more likely to die from Covid. However there is a significant bias due to age: more deprived areas tend to have younger populations; 75% of deaths with Covid recorded on the death certificate are in people aged 70+ in the most deprived areas compared to 90% in the least deprived areas; care homes whose residents have had particularly high mortality rates, tend to be located in less deprived areas.
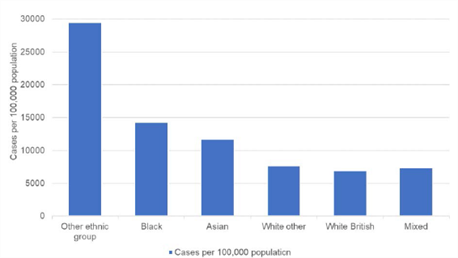
3.30 Ethnicity
3.31 In Staffordshire there has been a relatively higher number of confirmed cases of Covid in Black ,Asian and Minority Ethnic groups, with the cumulative confirmed case rate higher than in White Ethnic groups, as shown in Figure 14. Testing rates have typically been lower in Black, Asian and Minority Ethnic groups, and therefore it is likely that actual cumulative case rates in Black, Asian and Minority Ethnic groups are even higher. This is consistent with ward data: wards such as Eton Park, Shobnall, Anglesey and Burton in East Staffordshire with a high proportion of the population are from Black, Asian and Minority Ethnic groups have high cumulative confirmed case rates.
3.32 High case rates in Black, Asian and Minority Ethnic groups may be because people are more likely to live in large, multi-generational households with poor access to outdoor space, and/or are more likely to have jobs where they are exposed to Covid.
Figure 10: cumulative confirmed case rates to 19 July 2021 by deprivation decile
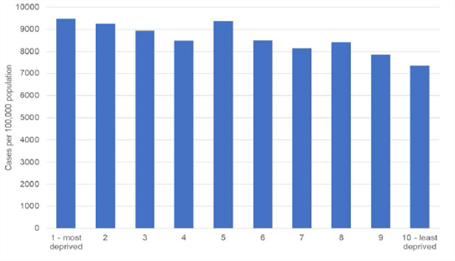
(Note: A deprivation decile places the deprivation scores of areas into one of ten groups of equal frequency)
Figure 11: tests per head of population 01 to 20 July 2021
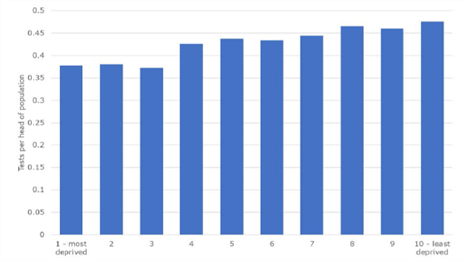
(Note: A deprivation decile places the deprivation scores of areas into one of ten groups of equal frequency)
Figure 12: deaths with Covid recorded on the death certificate by deprivation decile (March 2020 to June 2021)
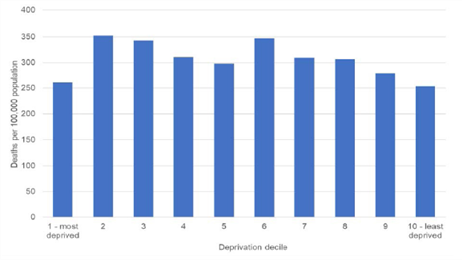
Source: Office for National Statistics – Monthly mortality data – March 2020 to June 2021
(Note: A deprivation decile places the deprivation scores of areas into one of ten groups of equal frequency)
Figure 13: excess deaths from all causes by deprivation decile (March 2020 to June 2021 vs. March 2018 to June 2019)
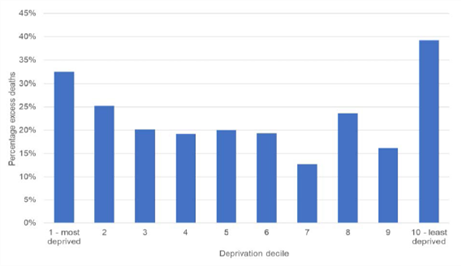
Source: Office for National Statistics – Monthly mortality data
(Note: A deprivation decile places the deprivation scores of areas into one of ten groups of equal frequency)
Figure 14: cumulative confirmed case rates to 19 July 2021 by ethnic group
4.1. Staffordshire’s response to Covid was a massive collective effort by the public sector, voluntary organisations, residents and businesses to minimise the spread of the virus and protect those most at risk.
4.2. The public sector response has been co-ordinated by the Local Resilience Forum through a Strategic Co-ordinating Group. This brought together local authorities, Police, Fire and Rescue, the NHS, and other agencies, drawing on military support, as well as expert advice from Public Health England. This is a standard way of managing emergency events such as the pandemic.
4.3. Local Resilience Forum partners as well as care providers and schools have worked tirelessly to mount a successful pandemic response – including:
- Sourcing supplies of Personal Protective Equipment (PPE) for a whole range of settings, with more than 6 million items provided so far.
- Providing information, advice and guidance for the public, care providers, schools and businesses.
- Supporting residents and businesses to understand and comply with Covid regulations.
- Providing practical support for care providers including additional staffing, financial assistance, and specialist advice to help with infection prevention and control.
- Providing education online and supporting vulnerable children and children of essential workers in schools.
- Establishing a network of symptomatic and asymptomatic testing sites as well as a contact tracing service.
- Rolling out the Covid vaccination programme.
- Supporting vulnerable people with supplies of food and medicine.
- Engaging with high risk communities to promote testing and vaccination.
- Maintaining essential public services in the face of reduced staffing.
4.4. None of this would have been possible without the support of voluntary organisations, residents and businesses. The public have made a huge contribution by supporting aspects of the pandemic response and by reducing social contact with family and friends, for a prolonged period.
4.5. Local Outbreak Management Plan
4.6. Staffordshire’s Local Outbreak Management Plan (LOMP) was first published in June 2020 and outlines the arrangements to ensure a successful response to Covid including: surveillance, testing, contact tracing, isolation, outbreak management, Covid security, vaccination, support for the most vulnerable, and communications and engagement.
4.7. Testing
4.8. Testing for SARS-CoV-2 infection in Staffordshire includes:
- Routine testing of people with symptoms of Covid using Polymerase Chain Reaction(PCR) tests. This provided by NHS Test and Trace through a network of sites managed nationally.
- Testing of people without symptoms with Lateral Flow Devices (LFD) to find cases and prevent the spread of the virus.
- Outbreak testing in settings or communities, with PCR and / or LFD.
- Surge testing for people potentially exposed to a new variant of concern, again with either PCR and / or LFD.
- Daily contact testing of close contacts with LFD instead of isolation.
4.9. Staffordshire has mounted a successful local asymptomatic testing programme that is both convenient to access and well promoted. This has achieved high rates of testing with LFD, as shown in Table 4. This may have contributed in part to relatively fewer cases than the regional or national averages over the course of the pandemic.
Table 4: LFD testing
| Area | Cumulative LFD tests up to 31 July 2021 | Population (ONS mid-year Estimate 2020) | Cumulative LFT tests per head population |
|---|
| Staffordshire |
2,353,301 |
883,172 |
2.7 |
| West Midlands |
13,065,981 |
5,961,929 |
2.2 |
| England |
126,249,016 |
56,550,138 |
2.2 |
4.10. Contact tracing
4.11. Contact tracing aims to reach confirmed cases and their close contacts to ensure that they isolate and are tested if necessary, in line with the prevailing regulations and guidance. Staffordshire has developed a successful contact tracing partnership with NHS Test and Trace.
4.12. Our local contact tracing team supports the national team by following up those confirmed cases they are unable to reach as well as following up all confirmed cases to explore potential sources of infection. The local team also carries out contact tracing efforts for those groups of people disproportionately impacted by Covid and/or under-represented in our communities – with these cases by-passing the national team. This allows contact tracing for these groups to be completed quickly and ensures that people have access to support.
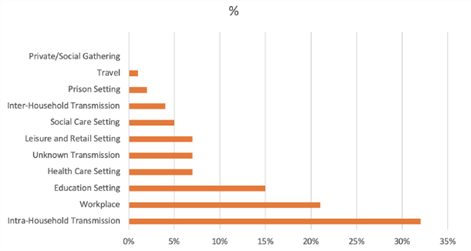
4.13. Staffordshire has achieved high rates of contact tracing. The cumulative number of cases managed was 74,077 at 21 July 2021, and 87% of these cases were reached, above the West Midlands average and similar to other counties, as shown in Table 5. Our local contact tracing efforts have allowed considerable insight into potential sources of infection which has supported outbreak management, as shown in Figure 15.
Table 5: Cumulative cases reached by contact tracing 28 May to 21 July 2021 (selected areas)
| Area | Total Cases | Total Reached | % |
|---|
| West Midlands |
531935 |
453122 |
85% |
| Staffordshire |
74077 |
64426 |
87% |
| Warwickshire |
41693 |
35941 |
86% |
| Worcestershire |
40961 |
36500 |
90% |
| Derbyshire |
61552 |
53496 |
87% |
| Nottinghamshire |
71114 |
62096 |
87% |
| Leicestershire |
55743 |
48154 |
86% |
Figure 15: Likely sources of Covid infection from local contact tracing
4.14. Support for isolation
4.15. Isolation of Covid cases and contacts was a legal requirement to reduce the spread of infection. For some people isolation can cause significant problems, for example it can lead to difficulties obtaining essential supplies, financial hardship due to loss of work, or loneliness. Staffordshire has offered a range of support for people including advice, befriending, help with food supplies, and financial assistance through Covid test and trace support payments, administered by District and Borough Councils, with 12,429 applications received to July 2021, of which two thirds were approved, as shown in Table 6.
Table 6: Covid test and trace support payments (R is received; A is approved – October 2020 to July 2021
| District / Borough | Statutory scheme R | Statutory scheme A | Discretionary scheme R | Discretionary scheme A | Total R | Total A |
|---|
| Cannock Chase |
629 |
211 (34%) |
1303 |
485 (63%) |
1932 |
696 (36%) |
| East Staffordshire |
1773 |
753 (58%) |
1303 |
485 (63%) |
3076 |
1238 (40%) |
| Lichfield |
n/a |
248 |
n/a |
108 |
1221 |
356 (29%) |
| Newcastle-under Lyme |
n/a |
281 |
n/a |
284 |
2054 |
565 (27%) |
| South Staffordshire |
346 |
164 (47%) |
605 |
78 (13%) |
951 |
242 (25%) |
| Stafford |
641 |
240 (37%) |
642 |
66 (10%) |
1283 |
306 (24%) |
| Staffordshire Moorlands |
409 |
182 (45%) |
412 |
59 (14%) |
821 |
535 (65%) |
| Tamworth |
518 |
298 (58%) |
573 |
237 (41%) |
1091 |
535 (49%) |
| Total |
|
|
|
|
12,429 |
4473 (36%) |
4.16. Outbreak management
4.17. Covid Incidents are identified when there is a single case, cluster or outbreak of Covid in a setting. An outbreak is defined as two or more new confirmed cases in the same setting within a 14-day period and with evidence of transmission within the setting. Local outbreak management teams have managed many incidents, with most in Adult Care, Education and High-Risk Places, Locations and Communities, as shown in Table 7.
Table 7: Summary of Incidents 04 June 2020 to 19 July 2021
| Setting | All Incidents | Outbreaks |
|---|
| Adult Care |
1296 |
259 |
| Community Healthcare and Community Settings |
310 |
52 |
| Education, Early Years and Children’s Social Care |
1844 |
356 |
| High-Risk Places, Locations and Communities |
2151 |
210 |
| Prisons and Other Prescribed Places of Detention |
20 |
10 |
| Total |
5621 |
887 |
4.18. Compliance and enforcement
4.19. The vast majority of residents and businesses followed Covid regulations and guidance during the pandemic, sacrificing their way of life for a prolonged period. Staffordshire’s approach to monitoring and ensuring compliance reflected this and sought to Engage, Explain and Encourage wherever possible, with use of Enforcement only where necessary.
4.20. Most Covid regulations came to an end on 19 July 2021. Over the course of the pandemic to July 2021 around 500 residents were issued with fixed penalty notices for breaches of regulations including unlawful gatherings and failing to isolate as confirmed cases or close contacts of Covid; and only three businesses were issued with directions to close or limit their activities for failing to maintain adequate Covid security. These low numbers are testament to the efforts made by the public and the proportionate approach adopted to enforcement in Staffordshire.
4.21. Personal protective equipment
4.22. Personal Protective Equipment (PPE) is used to protect the wearer from infection and prevent the spread of the virus. PPE includes face masks, gloves and aprons. Early in the pandemic PPE was a significant risk nationally as demand exceeded supply, and the subsequent shortages affected all frontline staff.
4.23. Staffordshire mitigated this risk by purchasing and distributing supplies of PPE and other products essential for infection control such as hand gel, cleaning products and waste bags. The first purchase was made on the 11 March 2020, ahead of the first lockdown and overall Staffordshire purchased 4,424,130 items of PPE during the pandemic. This swift action to establish a local supply chain allowed a consistent supply of PPE to be maintained until a reliable national supply chain was established. A total of 7,077,996 items of PPE were distributed through this local supply chain between April 2020 and 19 July 2021.
4.24. Vaccination
4.25. SARS-CoV-2 vaccines are safe and effective. The development and large-scale deployment of vaccines within 18 months has been a huge scientific and logistical achievement and has significantly reduced the risk of complications from Covid.
4.26. Staffordshire’s vaccination programme has been particularly successful. By the end of summer 2021, we had vaccinated a greater percentage of our population than West Midlands or England averages, as shown in Table 8. Efforts now need to continue to vaccinate younger adults, children from 12 upwards, and to ensure good coverage in all population groups.
Table 8: Percentage of eligible population receiving a Covid Vaccination at 12 September 2021
| Joint Committee on Vaccination and Immunisation priority groups* | All Incidents | All Incidents | All Incidents | Outbreaks | Outbreaks | Outbreaks |
|---|
| |
Staffordshire |
West Midlands |
England |
Staffordshire |
West Midlands |
England |
| Aged 80+ |
97% |
95% |
95% |
96% |
94% |
94% |
| Aged 75+ |
97% |
96% |
95% |
96% |
94% |
94% |
| Aged 70+ |
97% |
95% |
95% |
96% |
94% |
94% |
| Aged 65+ |
97% |
95% |
94% |
96% |
94% |
93% |
| Aged 60+ |
96% |
94% |
93% |
95% |
92% |
92% |
| Aged 55+ |
96% |
93% |
92% |
94% |
91% |
91% |
| Aged 50+ |
95% |
92% |
91% |
93% |
90% |
89% |
| Older adult care home residents and carers |
96% |
94% |
94% |
90% |
89% |
89% |
| Ages 16+ |
87% |
79% |
79% |
80% |
72% |
72% |
Source: National Immunisation Management System (NIMS), Public Health England
*Please note Local Authority level data is not available for all JCVI priority cohorts
4.27. Support for vulnerable people
4.28. During the pandemic, there was a lot of concern about people who were Clinically Extremely Vulnerable (CEV) and at very high risk from Covid, with conditions including cancers, severe respiratory conditions, and immunosuppression therapies. These people were advised to“shield” - in other words to isolate at home - and local authorities were asked to ensure that support was available on request.
4.29. 62,371 CEV people were identified in Staffordshire and contacted with an offer of support. In addition there were many calls from other vulnerable people with requests for support. Support included emergency food parcels, help with essential domestic supplies and medication, and befriending.
4.30. 3,318 emergency food parcels were supplied directly to CEV and other vulnerable people during the first 6 weeks of the first lockdown, as shown in Figure 16.
Figure 16: Emergency food parcels supplied April 2020 to July 2020
Lichfield - 266
South Staffs - 259
Staffs Moorlands - 248
Tamworth - 271
Cannock - 422
East Staffs - 511
Stafford - 785
Newcastle - 556
4.31. The voluntary sector provided most of the other support to CEV and other vulnerable people, co-ordinated by eleven ‘anchor organisations’:
- Cannock Chase: Chase Coronavirus Support Network
- East Staffordshire: Burton Albion Community Trust
- Lichfield: Methodist Homes Association (MHA)
- Newcastle under Lyme: Realise Foundation
- South Staffordshire: South Staffordshire District Council working with parishes and volunteer groups
- Stafford: Rising Brook and Stone Community Hub
- Staffordshire Moorlands: Biddulph Youth Action Zone, Homelink (Cheadle) and Haregate Community Centre (Leek)
- Tamworth: Communities Together
4.32. Support Staffordshire (SuS) and Staffordshire Council of Voluntary Youth Services (SCYVS) supported communication with the voluntary sector and supported many of the voluntary organisations and groups set up during the pandemic.
4.33. 4,719 referrals for support were made by statutory public sector organisations to the voluntary sector ‘anchor organisations’, as shown in Figure 17 and logged by the County Council. This chart does not include a further 3090 referrals into the voluntary sector, that were not attributable, the majority of which were direct referrals from the NHS. In the period between March and June 2020, the voluntary sector also provided a wide range of community level support, the breadth and scope of which, is shown in Figure 18.
Figure 17: Referrals to voluntary sector ‘anchor organisations’
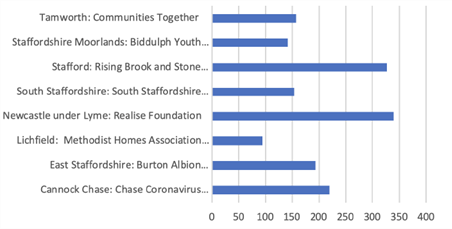
Figure 18: Voluntary sector support March to June 2020
Covid volunteers coming forward - 1967
Signposted to opportunities - 78%
Unique views to Covid webpages - 87,098
organisations contacted for support - 312
News stories shared - 264
Forum participants at 18 online forums - 140
Participants in 15 Covid training sessions - 117
Inward investment - £1.85M
VCSE District Leads supported to undertake - 9
Weekly food deliveries - 5,034
Prepared meal deliveries - 6,001
Prescriptions collections - 2,846
Befriending calls - 1,594
4.34. Hospital discharges
4.35. New hospital discharge pathways were introduced nationally in April 2020 to ensure the appropriateness and timeliness of discharges and maximise the hospital capacity available. These new hospital discharge pathways came with targets from NHS England to discharge:
a) 95% of people to their own homes: of whom more than half (50% of total discharges) would be ‘Simple and Timely’ discharges with no new or additional support; and the remainder (45% of total discharges) would receive support with reablement to help them recover their independence.
b) 5% of people to beds: of whom 80% (4% of total discharges) would be discharged to rehabilitation beds for therapy with the aim of returning home subsequently; and 20% (1%of total discharges) would be discharged to a permanent care home bed for the first time.
4.36. The pathways proved successful in Staffordshire in terms of minimising delays in hospital discharge, but less successful in terms of promoting independence, with an overreliance on bed-based discharges. There were over 22,000 complex discharges of people who received new or additional ongoing support, including reablement and rehabilitation, after hospital discharge. Compared to the target that 90% should be discharged home, only 67% were actually discharged home, an excess of over 5,000 bed-based discharges.
4.37. It is important that hospitals and discharge pathways promote independence and ensure sufficient capacity to support individuals at home, allowing people to return home wherever possible and minimising reliance on bed-based discharges.
5.1. Covid has had a range of impacts on our lives, well beyond the direct effects of the virus. Data on the wider impact of the pandemic is available from a range of sources including a survey of residents conducted by the County Council in summer 2020, summarised in Figure 19.
5.2. 63% of respondents experienced an overall negative impact from Covid, and this was especially the case for people furloughed (70%), people who have taken a break from work to look after family (68%) and people with a disability or limiting long term condition (67%). Negative impacts included not seeing family and friends, feeling concerned about vulnerable family and friends, and loneliness and isolation. A smaller proportion experienced an overall positive impact, although many were able to identify some positive impacts, such as being able to work from home, save money, and enjoy more time outdoors.
5.3. Health and well-being
5.4. Covid has highlighted and exacerbated poor health and health inequalities nationwide. The relatively high number of deaths in England compared to other developed countries was in part due to high levels of economic and lifestyle related health conditions such as obesity, diabetes, chronic heart disease and chronic lung disease.
5.5. Underlying poor health has been exacerbated by the pandemic. Nationally, obesity has risen as people have eaten more and exercised less, and mental health has suffered as people have been isolated for prolonged periods and faced uncertainty about their future. Younger people and children have seen a particularly adverse impact on mental health.
Figure 19: Social impact infographic
Vulnerable people:
62,371 Clinically Extremely Vulnerable individuals in Staffordshire and Stoke-on-Trent
Large number are WORKING AGE. Impact on support network as lockdown is eased.
Mental Health and Wellbeing
30% reporting high anxiety
63% of Staffordshire residents feel the pandemic has negatively impacted their life
Jobs, Employment and Poverty
3.8% claimant count in Staffordshire
2.2% pre-lockdown
Volunteering and Social Action
52% of Staffordshire residents supported others within their local community
Health Impacts
50% have not sought medical advice for worsening health conditions
Digital, The Way We Work
26% working exclusively from home compared to 37% in Feb 2021
24% of businesses plan to increase home working permanently
Children and Education
1-in-5 children aged 9-17 years are unhappy with their mental health
5.6. The adverse impact on mental health is also evident in Staffordshire. A Health watch survey found that half of respondents’ mental health has been adversely affected by the pandemic. The County Council’s survey of residents found those aged under 35 were more likely to report that their mental health had suffered. There has been a significant increase in referrals to Child and Adolescent Mental Health services, as shown in Figure 20, and this is only the ‘tip of an iceberg’ of increased mental health problems.
5.7. Some families may have been disproportionately affected by the pandemic; feedback from professionals indicates that mental health is particularly a problem in children with special educational needs, and from families with domestic abuse, poor living conditions and/or poor parental mental health.
Figure 20: Referrals to Child and Adolescent Mental Health services
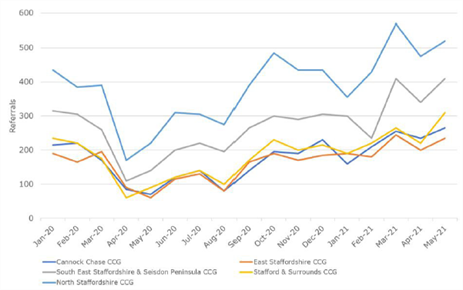
Source: NHS Digital
5.8. A range of mental health support has been provided for children and families including additional funding for the Staffordshire Emotional Health and Well-being Service, a peer support App, and the supply of laptops and wi-fi access for families most in need.
5.9. Education
5.10. Staffordshire schools made huge efforts to educate children during the pandemic. Attendance dropped during lockdowns when schools nationally were open only to children of key workers and vulnerable children such as those eligible for Free School Meals (FSM), with an Education, Health and Care Plans (EHCP), and/or with Special Educational Needs (SEN) as shown in Figure 21 for the second lockdown. This was compensated, at least in part, by online learning during these periods.
5.11. Taken over the whole autumn and spring terms the loss of school attendance was relatively insignificant: overall attendance in the 2020/21 school year was similar to previous years, although attendance in some groups of vulnerable children was down, as shown in Figure 22.
5.12. It is difficult to make any judgements about the impact of Covid on educational outcomes because no comparative data is yet available. This is something we should monitor over the next few years.
Figure 21: School attendance during second lockdown
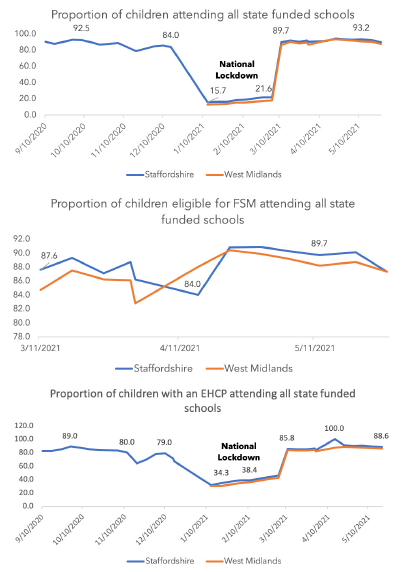
Figure 22: School attendance Autumn and Spring Term 2020/21 compared to previous years
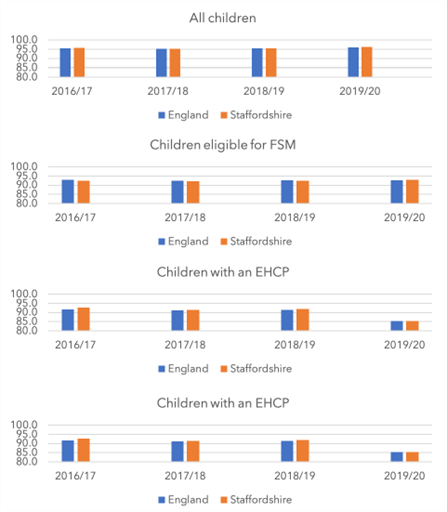
Source: Education Statistics Service
5.13. Employment
5.14. By July 2021, Staffordshire’s employment rate was 76%, above the England average rate of 75%. Employment rates have been increasing since February 2021 as businesses reopened and began recruiting.
5.15. The number of Universal Credit claimants in Staffordshire was 21,240 at July 2021, an increase of 9,090 compared to 12,050 in March 2020. This is a lower increase (75%) than the England average of 83%. Also the Universal Credit claimant rate in Staffordshire at 3.9% is lower than the England average of 5.5% of the working age population.
5.16. Young people, women, the lowest paid (including those in manual occupations, more routine or less skilled jobs) and part-time workers continue to feel the greatest impact of the economic shock caused by the pandemic. The proportion of young people aged 18-24 in Staffordshire claiming Universal Credit in July 2021 stands at 6.0% compared to 3.7% in March 2020. This has been decreasing as sectors such as retail and hospitality have reopened and begun recruiting.
5.17. Job vacancies have increased as businesses have reopened. Staffordshire saw vacancies increase by 5% between June and July 2021, equivalent to over 1,300 more jobs. In the longer-term we will need to consider labour and skills supply to avoid them becoming issues that hold back economic growth.
5.18. Health services
5.19. The first and second waves of the pandemic had a significant impact upon health services due to emergency hospital admissions of Covid patients, and reduced capacity because of staffing shortfalls and requirements for enhanced infection prevention and control. There was a substantial drop in non-Covid related hospital activity at the start of the pandemic, which had still not recovered by July 2021, as shown in Figure 23. This has led to a substantial increase in waiting lists for routine hospital work, as shown in Figure 24.
Figure 23: Staffordshire CCG registered patients hospital admissions
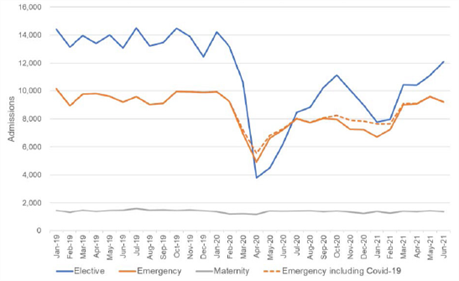
Source: NHS Digital Hospital Episode Statistics data
Figure 24: Staffordshire CCG registered patients waiting for hospital treatment
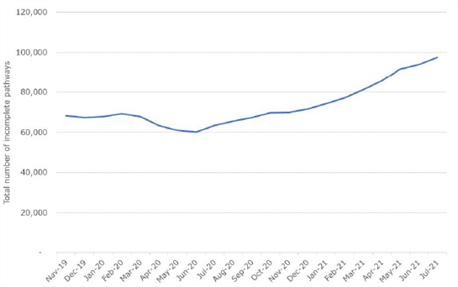
Source: NHS England
5.20. Whilst there was a rise in emergency hospital admissions of Covid patients, emergency hospital admissions for all other conditions fell markedly. This is interesting and unexplained: many emergency hospital admissions are linked to frailty and long-term conditions and it is unclear why these would have fallen. It is possible that lockdown acted to mitigate risk factors that would normally lead to an emergency hospital admission; it is also possible that the NHS managed these individuals differently. It would be useful to explore this phenomenon further to determine whether there is any learning for how people are managed post-pandemic.
5.21. Access to general practice was also affected by staffing shortfalls and requirements for enhanced infection prevention and control. This inevitably led to a substantial reduction in physical appointments in favour of virtual appointments. This worked well for many people, but may not be suitable for everyone longer term. There has recently been concern about whether an over reliance on virtual appointments might delay diagnosis or compromise management of long-term conditions, and result in an impact on the wider health and care system.
5.22. Care Homes
5.23. There are 249 registered care homes in Staffordshire, providing accommodation and 24-hour personal care to people who are unable to live safely in their own homes.
5.24. Care home residents have been particularly affected by the pandemic. Covid is a highly infectious virus and when introduced into a care home it has spread rapidly among residents very susceptible to serious disease due to advanced age and underlying health conditions. The implementation of enhanced infection prevention and control measures, with strict restrictions on residents’ movements and visiting, has also affected the quality of life of care home residents.
5.25. Over half of all care homes in Staffordshire have had a case or an outbreak over the course of the pandemic. There have been 4061 Covid cases linked to care homes between March 2020 and July2021, and between 13 March 2020 and 23 July 2021, 2833 deaths in care homes, 527 of which were Covid related.
5.26. A range of support has been provided to care homes including advice and guidance, supplies of personal protective equipment, infection prevention and control expertise, specific training, extra staff, access to well-being resources, assistance with testing and vaccination, and additional funding.
5.27. The impact of Covid on care homes will persist in the longer term. Care homes face a range of challenges including:
- Reduced capacity and bed occupancy, which reduces income and threatens the existence of care homes.
- Increased operating costs due to enhanced infection prevention and control standards, staff shortages and significantly increased insurance premiums.
- Recruitment and retention of staff; existing challenges have been compounded by requirements that staff only work at one care home, and for Covid vaccination as a condition of deployment.
5.28. Conclusions
5.29. Covid has had a range of wider impacts on our lives. Some of these effects may be transient and disappear in the wake of the pandemic; others may be more long standing. It will be important to review the data through a refresh of the Joint Strategic Needs Assessment and if necessary, address the issues Joint Health and Well-being Strategy.
5.30. The Joint Health and Well-being Strategy will need to reflect the imperative to tackle economic and lifestyle related health conditions such as diabetes, chronic heart disease and chronic lung disease, as well as obesity. Mental health should also be a high priority.
6.1. A qualitative review of the pandemic in Staffordshire has highlighted a number of features that contributed to a successful response.
6.2. Partnership working
6.3. Public sector partnership working throughout the pandemic has been exemplary. Agencies have demonstrated a ‘can-do’ attitude and focused on a shared goal of minimising the impact of the pandemic, implementing practical solutions to emerging problems at an unprecedented pace. New relationships have been forged, and governance and bureaucracy has been kept to an absolute minimum. This flexible and agile way of working has contributed to the successful response and is a blueprint for partnerships in the future.
6.4. Use of data
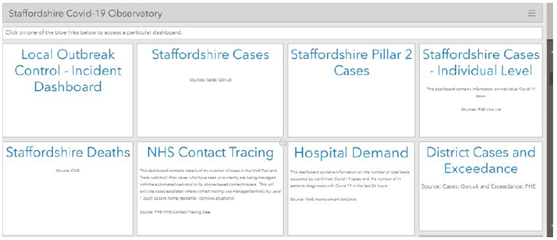
6.5. Effective use of data has enabled Staffordshire to maintain accurate and up-to-date situational awareness and inform the successful response. A web-hosted dashboard was created and shared and allowed us to bring together accessible and comprehensive real-time data, as illustrated in Figure 25.
Figure 25: The Staffordshire Covid dashboard
6.6. Use of technology
6.7. The pandemic accelerated introduction of a range of technologies and changed the way people used technology. This included a significant shift toward home working, enabled by apps and internet connectivity. The County Council’s survey of residents found that:
- 59% of residents did more online shopping
- 58% spoke to friends and family using digital technology
- Around 60% of people over the age of 65 had increased the use of online services for both staying in touch with others and for shopping.
6.8. Public sector organisations were part of this trend, using technology to enable home and mobile working by staff, and augmenting online services for residents. The County Council, for example, updated and augmented a range of digital resources, including Staffordshire Connects the Staffordshire County Council Website, a health app finder and an Independent Living site. Staff also made use of Facebook portals in Learning Disabilities service to support families during the lockdown.
6.9. Community action
6.10. The pandemic also led to a growth in community action, with individuals and groups supporting those most vulnerable. Section 4 described the role of the voluntary sector, and there was also a whole range of spontaneous and unstructured activity with residents and businesses reaching out to vulnerable people to offer a whole range of support. The County Council’s survey of residents found that over half of respondents had provided support to others with more than 90% of these willing to do so again. This is a huge resource that we should look to nurture, develop and use in the future.
R1 - Staffordshire should refresh the Joint Strategic Needs Assessment and Joint Health and Well-being Strategy to identify and address the longer-term impacts of the pandemic.
R2 - The Joint Health and Well-being Strategy will need to reflect the imperative to tackle economic and lifestyle related health conditions highlighted by the pandemic - such as diabetes, chronic heart disease and chronic lung disease, as well as obesity. Mental health should also be a high priority.
R3 - Hospitals and discharge pathways should promote independence and ensure sufficient capacity to support people at home, allowing people to return home wherever possible and minimising reliance on bed-based discharges.
R4 - Public sector partners should build on the relationships forged during the pandemic and the flexible and agile way of working that characterised the successful response to address other challenges in the future.
R5 - The use of data and the sharing of data has ensured a swift and robust response to the pandemic. We should explore the opportunities for continued data sharing to effectively meet the needs of Staffordshire residents.
R6 - The voluntary sector and community action was pivotal during the pandemic. Public Sector organisations should work collaboratively to maintain a vibrant voluntary sector and nurture and develop community action.
If you wish to print out this information, please use the document below: